BarChart |
-
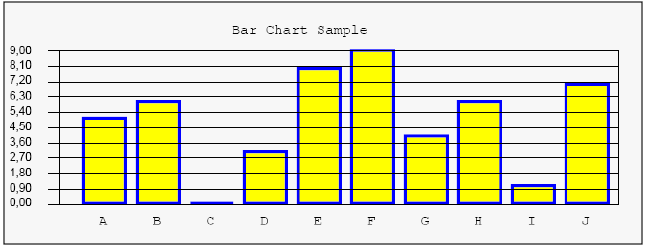
BarChart( init line, init col, height, width, data, data titles, chart title, color1, color2, nMin, nMax, nSteps, nGrTit ) => draws a bar chart, at position init line, init col with size height, width, using the values in data array, for each bar, a title in data titles is displayed. Bars are drawn using color1 for outline, and color2 for filling. A title can be displayed at the top/center of the chart using the chart title parameter. See a sample at Charts.PDF
|
Init line (numeric) :
|
Vertical position of chart corner according to coordinate system.
|
|
Init col (numeric) :
|
Horizontal position of corner to start drawing the chart.
|
|
Height (numeric) :
|
Height of box containing the chart.
|
|
Width (numeric ) :
|
Width of box containing the chart.
|
|
Data (array) :
|
An array of data values to be charted, one bar will be drawn for each element of the array, automatic scaling will be calculated according to lowest/highest value present in the array if nMin, nMax and nSteps is not specified.
|
|
Data titles (array) :
|
An array containing titles for each element in the data array, those titles will be displayed under each bar, so the quantity of characters in each title should not be long, so as to fit under the bar.
|
|
Chart title (character) :
|
Title of the chart, will be displayed on the center of the chart top row.
|
|
Color1 (numeric) :
|
Color for the outline of the drawn bars. Conforms to color definition in GRA.CH or any valid RGB color.
|
|
Color2 (numeric) :
|
Color for the filling of the drawn bars. Conforms to color definition in GRA.CH or any valid RGB color.
|
|
nMin :
|
The minimum value for the vertical axis. Default is the minimum value in the data.
|
|
nMax :
|
The maximum value for the vertical axis. Default is the maximum value in the data.
|
|
nSteps :
|
The quantity of steps of the scale in the vertical axis of the chart. Default is 10
|
|
nGrTit :
|
The angle at which the bars title will be drawn, default is 45º
|
Example : oPdf:BarChart( 65, 10, 14, 55, data, titu, "Bar Chart Sample", GRA_CLR_BLUE, GRA_CLR_YELLOW )
this will draw a bar chart with blue outlined bars and yellow fillings. See Demo.PDF for more details.

